
Letztes Update / Last Update: 2023-03-01
Jump to English VersionDieser Bericht ist für alle, welche schon immer mal Werte einer Wärmepumpe aus der Realität sehen wollten :)
Zuerst muss man allerdings festhalten, dass die folgenden Werte die spezifische Situation vor Ort widerspiegeln und daher nicht auf die allgemeine Qualität der Anlage oder des Herstellers geschlossen werden kann!
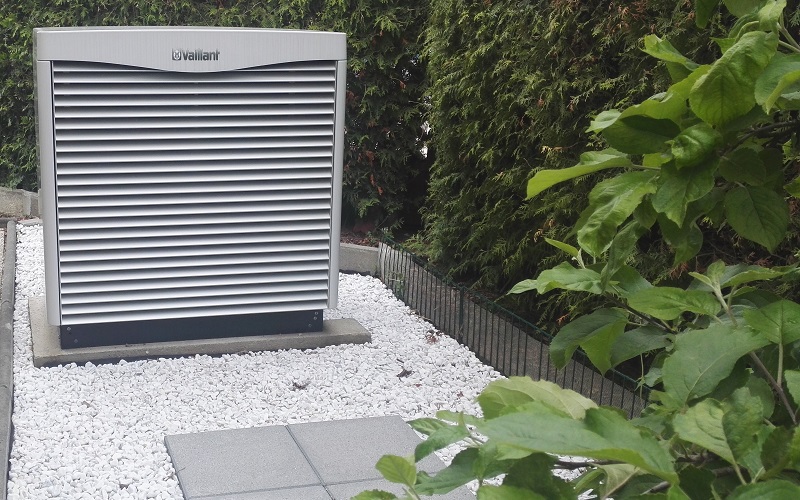
Bei der Wärmepumpe haben wir uns für eine flexoTHERM exclusive 117/4 der Firma Vaillant entschieden. Die Anlage ist seit November 2018 in Betrieb.
Die abgebildeten Diagramme zur Effizienz und zum Stromverbrauch im Vergleich zur Außentemperatur zeigen nur den Heizbedarf. Der Warmwasserbedarf ist exkludiert. Die dargestellte Außentemperatur ist der berechnete Mittelwert über einen gesamten Tag.
Die Daten stammen direkt von der Anlage und wurden aus der entsprechenden App ausgelesen. Die Effektivität setzt sich aus dem Verhältnis aus Stromverbrauch und Heizleistung zusammen.
Während die Effektivität in einem gewissen Rahmen allgemein gültig sein sollte, ist der Stromverbrauch für uns spezifisch zu sehen - siehe Gebäudedaten.
Es werden jeweils zwei Kurven dargestellt: Eine mit (für uns) angenehme Temperaturen und eine für reduzierte Temperaturen (Urlaubsmodus im Winter). Achtung, für den Urlaubsmodus liegen nur sehr wenige Werte vor!
Die Informationen werden laufend ergänzt.
This article is for all people who want to see real world values of a heating pump :)
First of all, we have to say that the following data displays our specific situation here. It cannot be used to conclude the general quality of the pump or the producer.
We decided us to go with the flexoTHERM exclusive 117/4 by Vaillant. The pump is in active use since November 2018.
The displayed diagrams of efficiency and the energy consumption in relationship to the outside temperature is only for heating demand. Domestic hot water is excluded. The consulted outside temperature is the calculated mean value of an entire day.
The data is provided by the heating pump itself and is read out by the corresponding app. The efficiency is calculated the ratio between the energy consumption and the heating output.
The efficiency should apply approximately in general. But the shown energy consumption is a specific value for our house.
There are two series painted in the diagrams: One for comfortable temperatures and one for reduced temperatures (vacation mode in winter). Attention, for the vacation mode are only very few values available.
The information will be continuously supplemented.
2019 | |||||
| Jan. | Feb. | Mar. | Apr. | May | June |
| 1850 | 1080 | 680 | 470 | 360 | None |
| July | Aug. | Sept. | Oct. | Nov. | Dec. |
| None | None | 120 | 400 | 700 | 1360 |
2020 | |||||
| Jan. | Feb. | Mar. | Apr. | May | June |
| 1750 | 950 | 1000 | 430 | 250 | 50 |
| July | Aug. | Sept. | Oct. | Nov. | Dec. |
| None | None | 70 | 500 | 1050 | 1500 |
2021 | |||||
| Jan. | Feb. | Mar. | Apr. | May | June |
| 1650 | 1500 | 1300 | 900 | 430 | 90 |
| July | Aug. | Sept. | Oct. | Nov. | Dec. |
| 55 | 90 | 150 | 540 | 1020 | 1520 |
2022 | |||||
| Jan. | Feb. | Mar. | Apr. | May | June |
| 1760 | 1230 | 1340 | 550 | 80 | None |
| July | Aug. | Sept. | Oct. | Nov. | Dec. |
| None | None | 145 | 230 | 760 | 1460 |
2023 | |||||
| Jan. | Feb. | Mar. | Apr. | May | June |
| 1250 | 1130 | - | - | - | - |
| July | Aug. | Sept. | Oct. | Nov. | Dec. |
| - | - | - | - | - | - |
2024 | |||||
| Jan. | Feb. | Mar. | Apr. | May | June |
| - | - | - | - | - | - |
| July | Aug. | Sept. | Oct. | Nov. | Dec. |
| - | - | - | - | - | - |